saxj1810.8-2609
272.6860° -26.1510°
Quick-look results provided by the
ASM/RXTE team
Web page design and software coding by
Derek Fox
Data solution currently runs through Week 831 (continuous coverage
from 2/20/96 to 1/1/2012, MJDs 50133-55927). Plots show only recent
data, but all data are accessible through the form
interface.
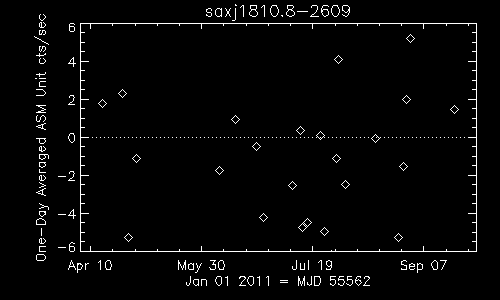
| One-Day Averages |
 |
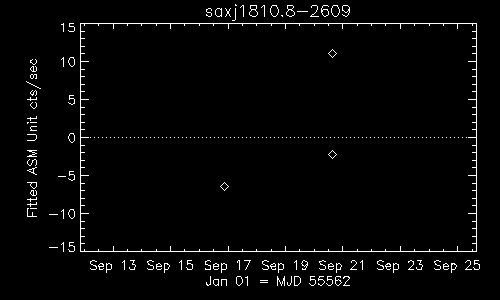
| Dwell by Dwell |
 |
Filters for ASM quick-look data:
- Reduced chi-square of the fit <1.5, except for
Sco X-1 <8.0
- Number of sources in the field of view <16
- Earth angle >75 degrees
- Exposure time >30 seconds
- Long-axis angle theta: -43< theta <46 degrees
- Short-axis angle phi: -4.8< phi <4.8 degrees
For the last two items, note that the full SSC field of view is 110
degrees (theta) by 12 degrees (phi).
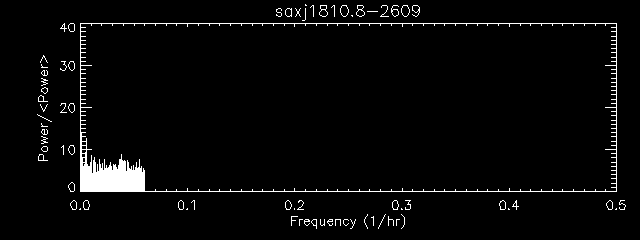
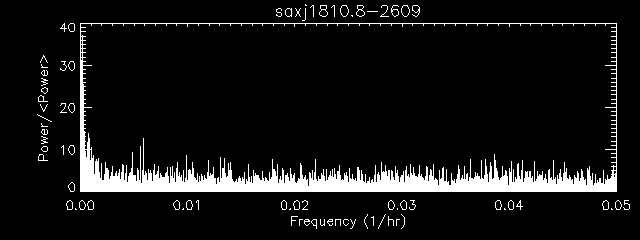
The Power Spectrum ASCII data file
contains two columns:
- Frequency (in 1/hours)
- Power/<Power> for that frequency
Power density spectra are created by averaging the light curves into
0.05 day (1 hour 12 min) bins, subtracting the mean value of all
inhabited bins from each inhabited bin, and taking an FFT. The
resulting power in each frequency bin is divided by the average power
over the whole frequency range. Note that the frequency is plotted in
inverse hours.


