Last updated: Fri Jan 21 16:00 EST 2000
This Web Page maintained by Dr. Donald A. Smith of the RXTE/ASM team at the MIT Center for Space Research.
D. A. Smith, A. M. Levine and E. H. Morgan (MIT) report on behalf of the RXTE All-Sky Monitor (ASM) team at MIT and NASA/GSFC:
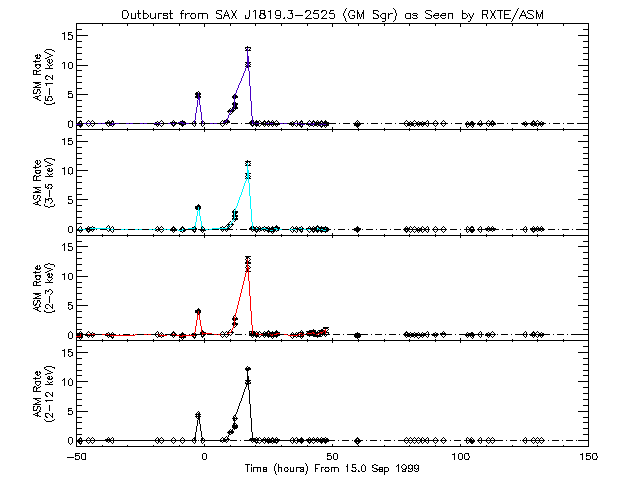
On 1999 Sep. 15.420 (UT), SAX J1819.3-2525 (= XTE J1819-254), an X-ray transient likely to be associated with the variable star V4641 Sgr (IAUC 7119), was measured by the ASM to have an intensity of 1.55+-0.04 Crab (2-12 keV; estimated error is based solely on counting statistics). Subsequent measurements over the following hours showed a rapid increase in X-ray intensity: 1.32+-0.04 Crab (Sep. 15.422), 1.43+-0.04 Crab (Sep. 15.423), 2.41+-0.04 Crab (Sep. 15.488), 3.74+-0.05 Crab (Sep. 15.489), 10.0+-0.2 (Sep. 15.701), and 12.2+-0.2 (Sep. 15.703). The spectrum is harder than that of the Crab Nebula. These results were obtained following receipt of the report from R. Stubbings of the optical brightening of V4641 Sgr (vsnet-alert 3477).
Here is the lightcurve in Crab units (for each energy band). Each point represents an average over a 90-s ASM dwell. Back-processing revealed an earlier outburst that reached five Crab (a disadvantageous orientation of the satellite prevented us from noticing this point earlier) at Sep 14.89 (UTC). This coincides with the flare reported by BATSE in IAUC 7256 (see multiwavelength figure below). An even earlier episode of activity in the ASM data was found between Sep 10.0 and 10.2, with (2-12 keV; 90-s average) intensities around 0.1-0.4 Crab (this flare is not plotted here).
The ASM count rates for the Crab are 75.5, 26.8, 23.3, and 25.4 c/s in the bands 2-12, 2-3, 3-5, 5-12 keV, respectively.

If we integrate under the curve in the bottom panel of the above graph (using a linear interpolation scheme and a simple conversion to energy flux units by assuming 1 Crab is 2.8e-8 ergs/cm^2/s over the 2-12 keV band) then if this source is at a distance from Earth of 0.5 kpc, roughly 10^(41) ergs of energy were emitted between 2 and 12 keV during the final outburst, and 10^(40) ergs during the precursor.
If the energy for this radiation was extracted from the release of gravitational potential energy through a mass falling onto some compact object, then the falling mass would have on the order of 10^(21) g, give or take a few orders of magnitude, about a millionth of the mass of the Earth. These numbers should not be taken too strictly. The source is clearly highly variable (see below), rendering the linear interpolation immediately suspect, and the mass of the compact object is unknown. However, within the limitations of the approximations, they do give an order of magnitude estimate of the quantities involved.
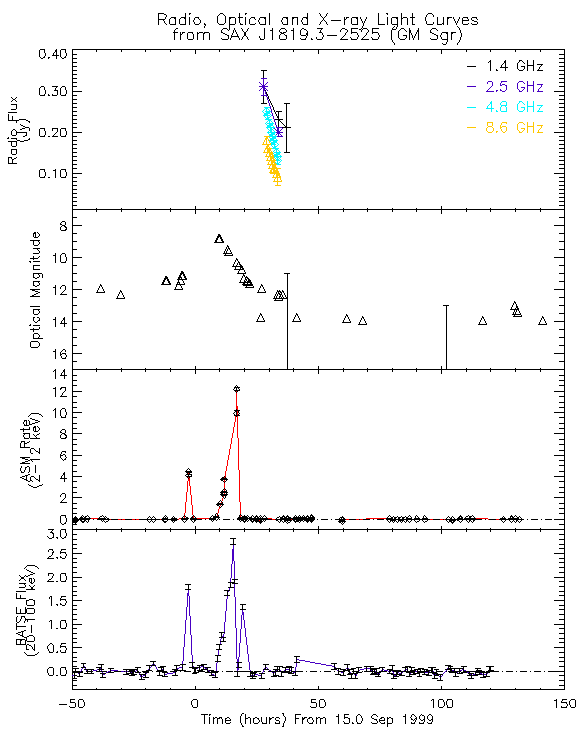
Here is a comparison of the outburst between X-rays, Radio, and Optical intensity. Again, the X-ray intensity is given in terms of the Crab.
The optical magnitudes are courtesy of the VSNet, and the original data, as well as the observers' names, can be found in the VSNet alerts. In particular, here is the file used to generate this figure. Additional data were provided by Dr. Pablo Rodriguez-Gil. There is also a VSNet page dedicated to V4641 Sgr.
The radio data are courtesy of Dr. Bryan Gaensler. More radio data are available (including an image), on a web page provided by Dr. Robert Hjellming at NRAO.
The BATSE data are in photon flux units (20-100keV), created using a power law spectrum with index of -3.5. The high point before the gap at around 42 hours may not be real. The BATSE data are courtesy of Dr. Michael McCollough.

Although it appears that the last BATSE high point occurs during a time when no X-ray activity is detected by the ASM, that data point corresponds to a time of 19.211 h (since Sept. 15.0 UTC). This time falls in a gap between ASM measurements at 18.466 h and 20.035 h, and as the PCA data below indicate, the source varies by Crabs on timescales shorter than the ASM coverage, so the ASM measurements do not contradict the final BATSE flare. See also the comments on the PCA data, below.
Also of interest is that the ASM light curve peaks at 16.852 h, while the BATSE light curve peaks at 15.453 h, and is decaying at 16.062 h. At 17.027 h, BATSE cannot detect the source. This may be evidence for rapid spectral softening at the peak, or both instruments may be sampling different portions of a rapidly fluctuating outburst that lasts from around 5 h to around 22 h.
On the other hand, the source clearly softened in the ASM data as it brightened. Here are the hardness ratios for the observations during the rise:
| Date (MJD) | Flux | C/A | C/B | B/A |
| 51436.420521 | 1.6 | 4.6 | 1.9 | 2.4 |
| 51436.421632 | 1.3 | 2.4 | 2.3 | 1.0 |
| 51436.422743 | 1.4 | 4.7 | 2.8 | 1.6 |
| 51436.488299 | 2.3 | 1.4 | 1.6 | 0.9 |
| 51436.488299 | 2.6 | 1.8 | 1.7 | 1.1 |
| 51436.489410 | 3.7 | 1.6 | 1.7 | 0.9 |
| 51436.701077 | 10.0 | 0.8 | 1.2 | 0.7 |
| 51436.702187 | 12.2 | 0.9 | 1.2 | 0.8 |
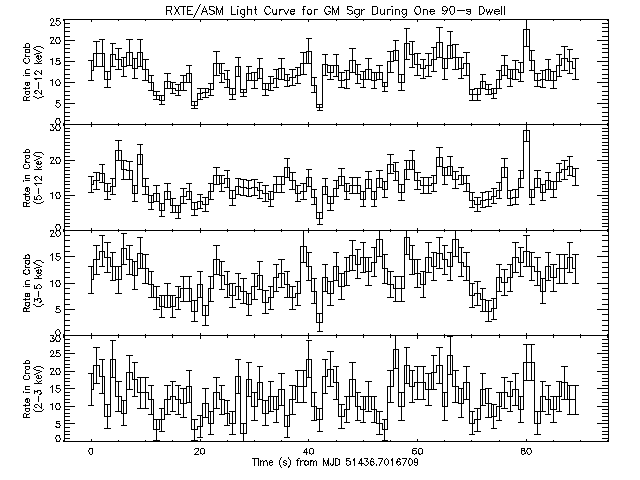
Here is the lightcurve for V4641 Sgr in 1-s bins over the course of a single 90-s dwell, given in units of the Crab for each energy band. The average 2-12 keV flux from this source over the course of this observation was 12.2 Crab, the brightest ASM point in the above light curves. Note the extreme variations on short time scales, with changes in intensity exceeding 10 Crab in a few seconds.

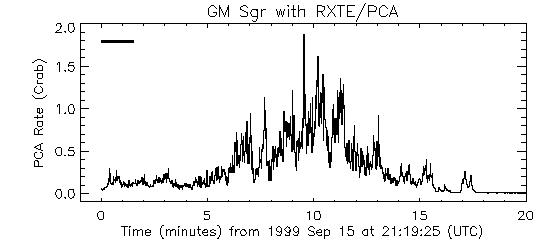
Finally, a 5 ksec public PCA observation of this source was performed at Sep 15.8875 (UTC). The source showed wild variability for the first 17 minutes, but then settled down to a level at or just above background for the rest of the observation. Here is a graph showing the PCA light curve (2-60 keV), converted to Crab units. A horizontal black bar indicates an interval when the source was simultaneously viewed by the ASM. The ASM measured an average intensity (2-12 keV) of 42+-24 mCrab during this 90-s interval. The mis-match between PCA and ASM measurements is likely due to deviations of this source's spectral shape from the Crab spectrum.

See also:
- The initial alert from Rod Stubbings.
- The VLA and GBI monitoring of V4641 Sgr.
- The Marshall Space Flight Center has created a web page showcasing the BATSE results.
- Palomar Optical Spectrum of V4641 Sgr in Outburst (ATEL 44)
- Detection and Possible Flare of V4641 Sgr at 29-34 GHz (ATEL 45)
- BATSE detects hard X-rays, PCA reports flaring (IAUC 7257)
- Radio Decay; Optical Magnitudes (IAUC 7256)
- Spectral Lines, Bright Radio Source (IAUC 7254)
- 1999 Sep 15 Optical and X-ray Flare; Correct coordinates (IAUC 7253)
And from its first outburst:
- Original detection of 1999 Feb 20 80-mCrab X-ray flare on 1999 Feb 20 (IAUC 7119)
- Independent 1999 Feb 18 RXTE Detection (IAUC 7120)
Some press responses:
- The Astronomy Picture of the Day for 2000 Jan 17.
- A Space.com article.
- An older Space.com article.
- The Washington Post has the AP Article.
- Sky and Telescope has a blurb on their News page (as of Jan 19, 2000).
- The Discovery Channel has an article.
- Here's an Australian article.